Colony health
Varroa mite tracking software
ApiaryPilot records every varroa count and treatment per colony, converts counts into a comparable infestation rate, charts the trend across the season and warns you when a colony crosses the threshold where action is needed.
Last updated
Why varroa needs a number, not an impression
Varroa destructor is the single biggest cause of colony loss in managed European honey bee colonies, mostly through the viruses it spreads rather than the mites themselves. The damage builds quietly: a colony that looks strong in July can collapse in October because the winter bees were raised while mite levels were high.
The only reliable way to manage that risk is to measure it. Counting mites on a sample of bees gives you an infestation rate you can compare between colonies, between apiaries and between years. Guessing from the number of mites you happen to see on the landing board does not.
Recording counts that mean something
ApiaryPilot supports the monitoring methods beekeepers actually use, and stores what each result was based on so a count in April is comparable with a count in August.
- Alcohol wash or soapy water wash — most accurate, typically a 300-bee sample
- Sugar roll — non-lethal, same 300-bee sample, slightly lower recovery
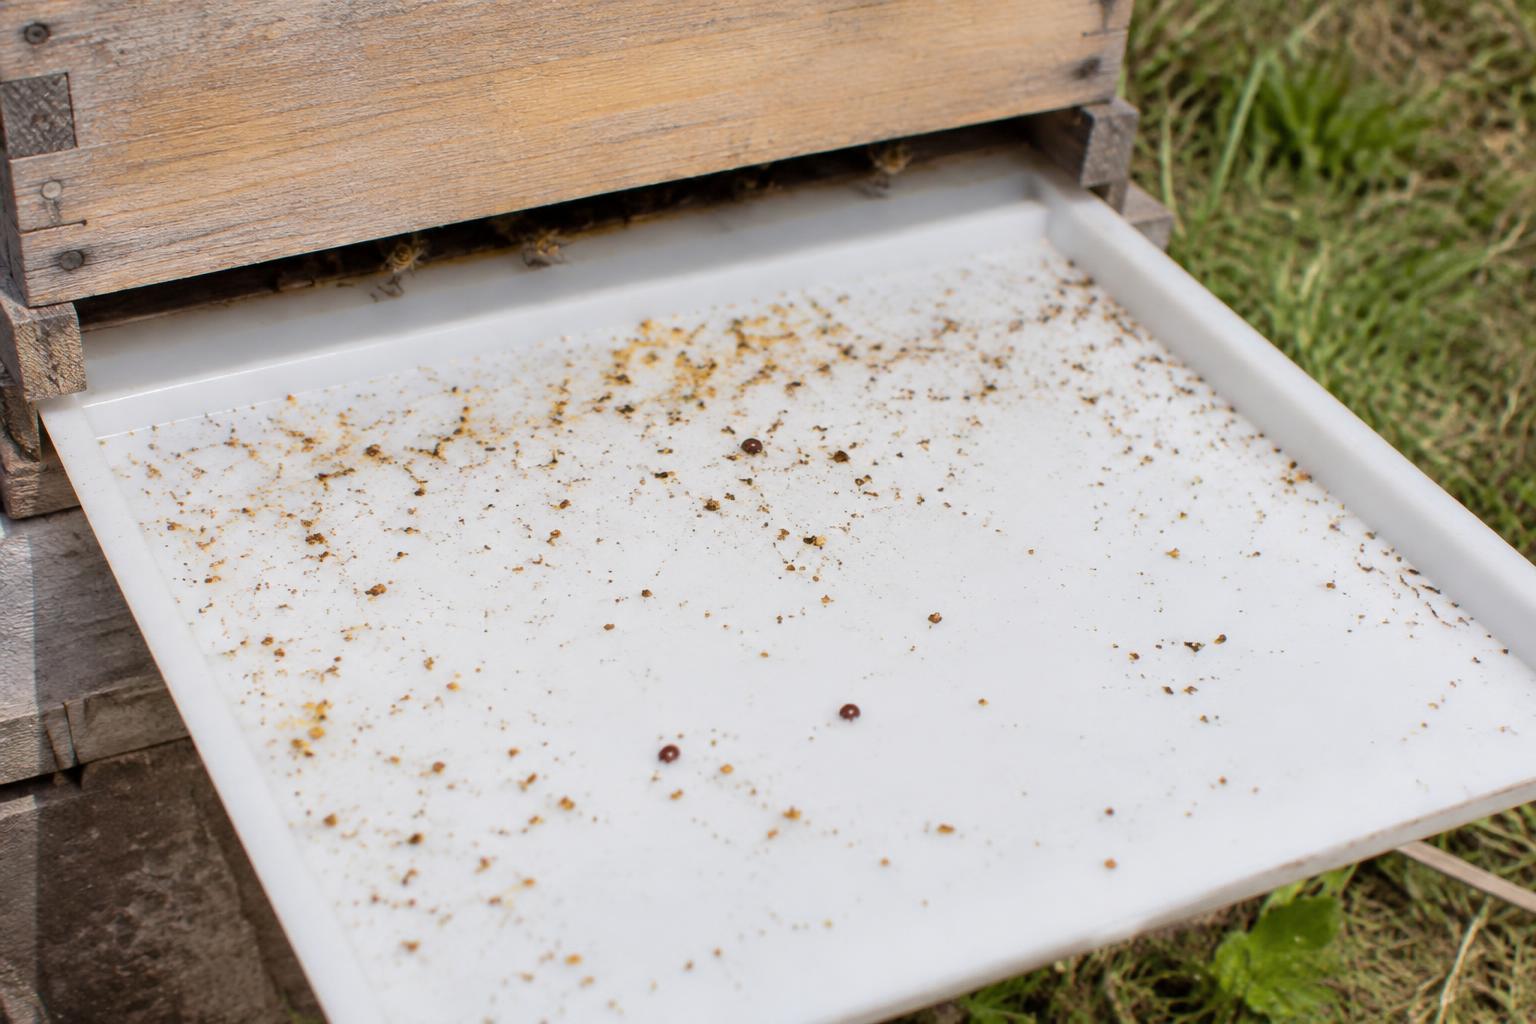
- Sticky board / natural mite drop — recorded as mites per day over the number of days the board was in
- Drone brood uncapping — useful as an early-season indicator
Thresholds and the season trend
Each count is converted to mites per 100 bees so you can act on a consistent figure. ApiaryPilot flags colonies that cross a 3% infestation rate, a commonly used action threshold in late summer, and highlights any colony whose rate is climbing quickly even while it is still below the line.
The colony health chart puts counts, treatments and colony strength on the same timeline. That makes the important question easy to answer: did the treatment actually bring the mite level down, or did it bounce back within weeks?
Treatment records include the product, the dose, the dates in and out, and the temperature conditions — the details that determine whether a treatment worked and the details an inspector may ask about.
Integrated pest management, documented
Good varroa control mixes monitoring, biotechnical methods such as drone brood removal or a brood break, and correctly timed treatments. That approach only works if you can see what you did last time, because every intervention has a best window and a maximum frequency.
ApiaryPilot keeps the whole programme in one place: monitoring dates, biotechnical actions, treatments, and the counts that followed them. Repeating the same product year after year becomes visible instead of accidental.
At the end of the season you can export a treatment and monitoring history per colony or per apiary — useful for your own review, for veterinary or regulatory records where they apply, and for honey buyers who ask about residues.
Questions
Frequently asked questions
How do I track varroa mite counts?
Take a standard sample — usually 300 bees from a brood frame without the queen — wash or sugar-roll it, count the mites recovered and divide by the sample size to get mites per 100 bees. Record the method, date and result per colony so the numbers stay comparable, and repeat monthly through the active season.
What varroa level is too high?
Many European and North American extension services treat around 3 mites per 100 bees in late summer as the point where intervention is needed, with lower thresholds before winter bee rearing. ApiaryPilot flags colonies at or above 3% and shows the trend so you can act before the threshold is crossed.
Does ApiaryPilot tell me which treatment to use?
No, and deliberately so. Approved varroa products differ by country, and the right choice depends on temperature, brood status and whether supers are on. ApiaryPilot records what you used and what happened afterwards; your national beekeeping authority remains the source for approved products.
Can I see varroa levels across a whole apiary?
Yes. The health dashboard summarises infestation rates per apiary and lists the colonies driving the average, which is usually where reinvasion pressure is coming from.
Get started
Try it with your own hives
Start a 7-day free trial — no credit card needed. Plans start at €9 per month and include the full ApiaryPilot Academy.